How accurate is a solar forecast, really?
The short answer for a single roof, measured on our own users’ production records: the median daily error is about 10% when the sky is clear and about 18% when it is fully overcast. That is one number per day, comparing the forecast for that day against the kilowatt-hours the inverter actually made — not irradiance, not a fleet average, and not a best case.
Most published accuracy figures are not comparable with that, and the reason matters more than the numbers themselves.
What the error actually does as clouds come in
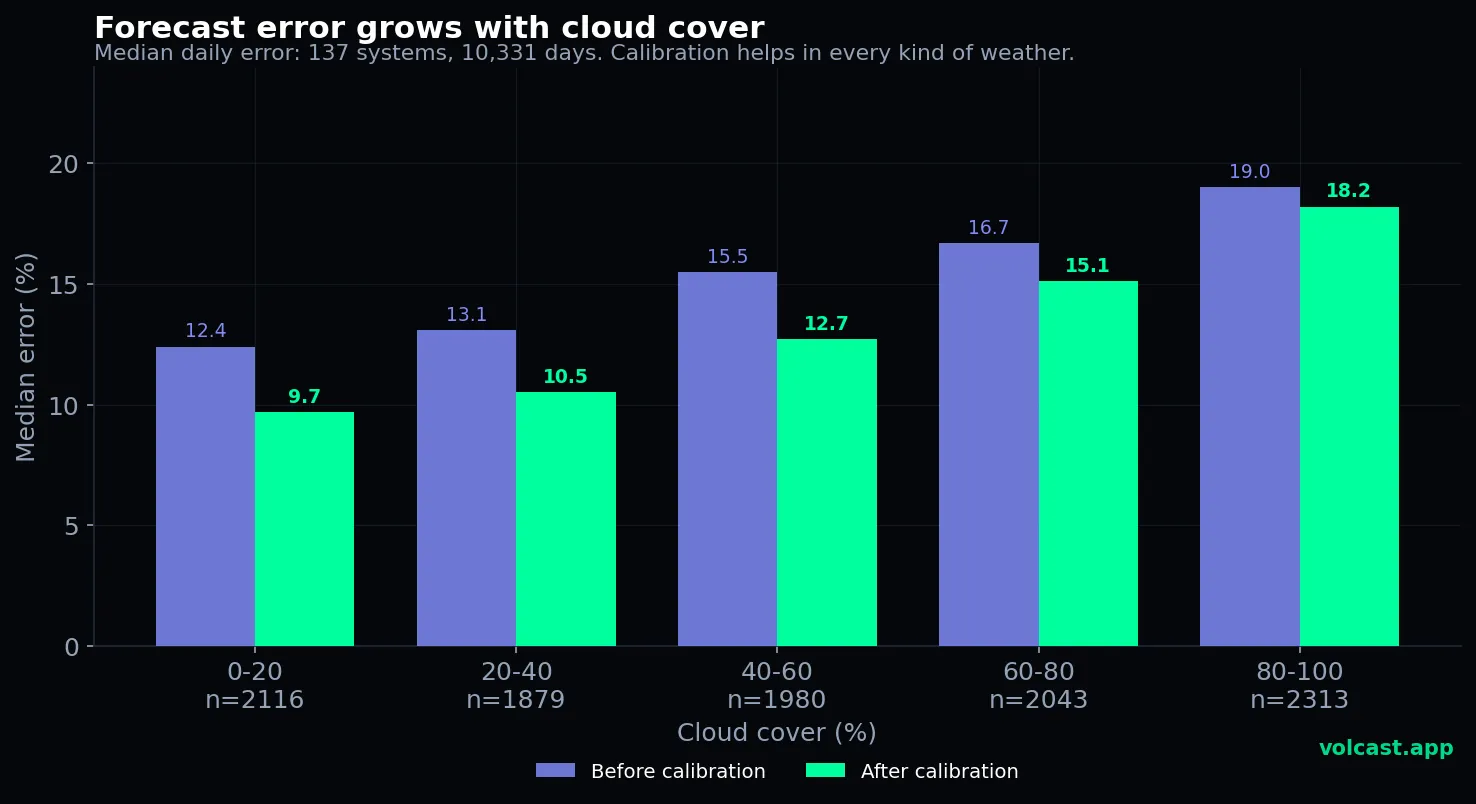
The cohort is 137 systems with at least 20 days of data and at least five clear days each. Fifteen more were left out because their clear-sky ratio of forecast to production sat outside 0.75–1.33 — that is the signature of a wrongly entered system size, not a forecast error. Keeping them in pushed the share of clear days missing by more than 30% from 8% up to 14%.
Two things are worth reading off this chart, and the second is the one almost nobody publishes.
The first is that error climbs steadily with cloud: 9.7% in the clearest bucket, 18.2% in the most overcast one. No cliff, no surprise — just a steady slope, because broken cloud is genuinely the hardest thing in this whole problem to predict.
The second is that the median bias stays between 0.96 and 1.01 in every bucket. Bias is direction; error is size. A model that systematically over-predicts in clouds would show a ratio drifting well below 1, and this one does not. So when your forecast misses on an overcast day, it is roughly as likely to have been too high as too low. The forecast does not get pessimistic in bad weather — it gets noisier.
That distinction is practical, not academic. Random error averages out across a week, which is why weekly planning still works when a single day does not. Systematic error never averages out, and that is the kind worth chasing.
Why comparing this with vendor numbers is mostly a trap
You will find accuracy claims in the 5–15% range across the industry. Most of them are measuring something easier than your roof.
Irradiance forecasts are easier than production forecasts, because they stop before the messy part: your panel angle, your inverter’s clipping point, your shading, the temperature coefficient. Fleet aggregates are easier than single sites, because errors on a hundred roofs cancel each other out — that is simply how averaging works, and it flatters the number by a lot. And accuracy quoted on clear-sky days only is a different claim again.
Ours is the hard version of the measurement: one roof, one day, actual kilowatt-hours. When you compare, the only question worth asking is what exactly was measured.
The part you can verify yourself
None of the above is worth much if you cannot check it, so here is the method — it is the same one we use internally.
- Take at least four weeks of days. Fewer than that and you are measuring weather, not accuracy. A single bad day proves nothing in either direction.
- For each day, compute |forecast − actual| ÷ actual. That is the daily absolute percentage error. Take the median of those, not the mean — one storm day would otherwise dominate the whole result.
- Split clear days from cloudy ones before averaging anything. Mixing them produces a number that describes neither, and it is the single most common mistake in these comparisons.
- Check the direction separately. Average forecast ÷ actual across your clear days. Near 1.0 means the size of your system is entered correctly. Consistently near 0.8 or 1.2 means it is not, and no forecast model will fix that for you.
Step 4 is where most disappointing results actually come from. A constant offset is a configuration problem wearing the costume of a forecast problem, and it is worth ruling out before you judge anything else.
What to expect from calibration
The indigo bars on the chart are the raw physics model; the green ones are after the calibration loop has watched your roof for a couple of weeks. The gap is consistent — roughly two to three points in every weather bucket, which is a larger effect than the difference between two competing forecast providers.
It is also why accuracy quoted on day one means little. A model that has never seen your system is working from your declared capacity, angle and orientation, and those are approximations of a real roof with a real chimney on it.
The honest summary
For a single roof, on daily kilowatt-hours, over a full range of weather: the median day lands within roughly 10–18% depending on cloud, with no systematic lean in either direction, and about 8% of clear days and 28% of heavily clouded days miss by more than 30%.
That is good enough to plan a wash cycle, an EV charge or a heat-pump run around tomorrow’s production window. It is not good enough to trade energy on a single day’s number, and anyone telling you otherwise about any forecast is selling something.