Solar production forecasting — how to predict tomorrow's PV output accurately
How much power will your system produce tomorrow? Most solar owners answer “depends on the weather” — and leave it there. Yet PV output can be forecast to around 85% accuracy after calibration on sunny days, hour by hour. All it takes is combining weather-model (NWP ensemble) irradiance data with a physical model of your specific system: its azimuth, tilt, capacity and shading.
This article explains how professional production forecasting works, why a regular weather app isn’t enough, and how to use a forecast in practice — so you consume your own power when you have it, instead of exporting it to the grid for a fraction of its value.
Why a weather app isn’t enough
“Sunny tomorrow” tells you almost nothing about yield. Between the weather report and the kilowatt-hours off your roof sit several layers of physics.
Irradiance is not cloud cover. Weather apps show cloud percentage, but panels respond to irradiance — the power of solar radiation reaching a surface, measured in W/m². A thin veil of cirrus and a low, dense stratus deck can both read “60% cloudy” and differ in production by a factor of two.
Your roof’s geometry. The same irradiance yields different output on a south-facing roof at 35° than on an east–west array at 15°. Add string configuration, bifacial panels and — most often ignored — the shading profile: a chimney, the neighbour’s tree, or the hill the sun disappears behind at 4 pm.
Temperature works against you. Panels lose efficiency as cell temperature rises (typically ~0.3–0.4% per degree above 25 °C). That’s why record production days are often a sunny, cool spring day rather than a scorching midsummer one.
A good production forecast therefore has to run the full chain: weather-model (NWP ensemble) irradiance data → solar position model → your system’s geometry and parameters → temperature and spectral corrections → kWh for every hour.
How physics-based forecasting works
Modern PV forecasting systems — from utility-scale tools to prosumer apps — follow the same scheme:
- Inputs: weather-model (NWP ensemble) irradiance forecasts (GHI, DNI, DHI), plus numerical weather models supplying temperature and wind.
- Transposition model: converting irradiance from the horizontal plane onto the plane of your panels, for the sun’s position at every hour.
- System model: peak power, inverter efficiency, system losses, shading as a function of time of day and season.
- Output: the production curve — today, tomorrow, the days ahead.
An out-of-the-box model like this is decent. But every installation has quirks: slightly different losses, underestimated shading, panels ageing at their own pace. That’s where the second piece comes in.
Calibration: a forecast that learns your roof
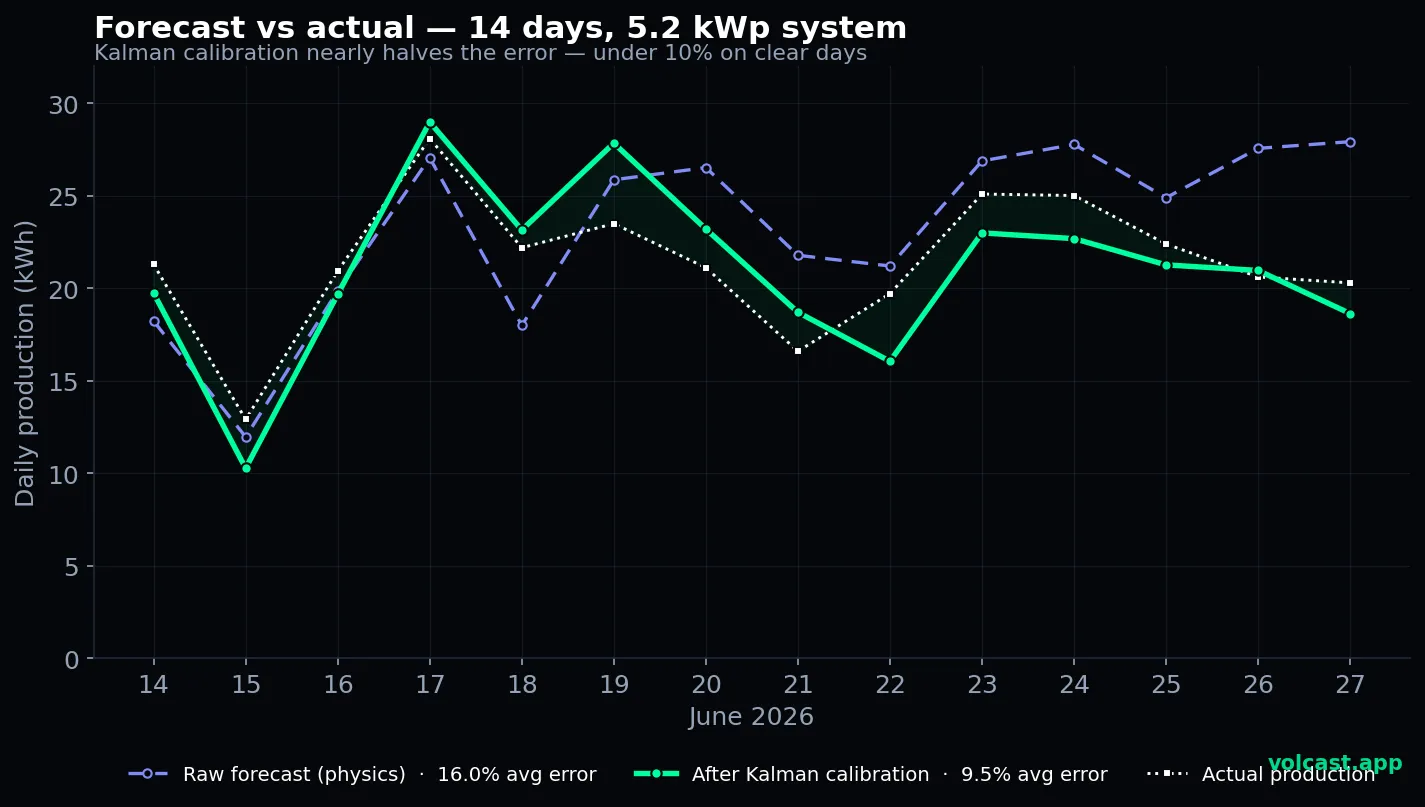
The most effective approach is comparing forecasts against actual production and systematically correcting the model. At Volcast we do this with a Kalman filter — an algorithm known from satellite navigation that, with every new measurement, updates the model’s parameters exactly as much as that measurement is trustworthy.
In practice: you log your actual daily yield, and after a couple of weeks the model “knows” things about your system that no datasheet contains — the real impact of autumn shading, actual inverter losses, panel degradation. On my own 5.2 kWp system, the calibrated next-day forecast is off by less than 10% on sunny days.
What a production forecast actually does for you
Planning consumption. Wherever export is paid less than retail — which is nearly everywhere now — every kilowatt-hour consumed directly is worth two to four times an exported one. If you know tomorrow’s surplus lands between 11 am and 2 pm, that’s when the water heater, washing machine, dishwasher and EV charger run. Details here: When to run your appliances on solar →.
Home automation. The forecast can feed Home Assistant and drive devices automatically: the immersion heater only runs on predicted surplus, the heat pump shifts hot-water cycles into the production peak.
System health monitoring. If actual production consistently drifts from the calibrated forecast, something is wrong — dirty panels, a growing tree, a failing string. The forecast is the reference point your inverter app (which only shows the past) never gives you.
Get started in 5 minutes
- Install an app with a physics-based forecast — Volcast is free to start (2-day forecast) and works with any system: no inverter login, no API keys, no cloud connection to your hardware.
- Enter your parameters: azimuth, tilt, capacity, optionally string layout and shading profile.
- You get an hourly forecast from day one; logging actual production switches on auto-calibration, which tunes the model to your roof week by week.
FAQ
How accurate can a solar production forecast be? After calibration, typically around 85% on sunny days. The hardest are days with fast-moving cumulus — even the best models scatter more there, though the daily total usually stays reliable.
Do I need access to my inverter to forecast production? No. The forecast is built from weather-model (NWP ensemble) data and your system’s parameters. Inverter access only helps to log actual production automatically for calibration — entering it manually once a day works just as well.
What’s the difference between an irradiance forecast and a production forecast? An irradiance forecast tells you how much solar energy will arrive. A production forecast runs it through your specific system’s geometry and parameters to give kilowatt-hours off your roof.
Does forecasting work in winter? Yes — winter has more overcast days with higher relative error, but that’s exactly when a forecast is most valuable: it flags the few sunny days worth shifting your consumption to.